Instrumentation in your applications is very critical as it helps you understand how your applications are performing and thereby proactively help identify issues affecting them and the resources they depend on.
Azure provies you with Azure Monitor & Application Insights tools to implement a good instrumentation strategy for profiling your applications.
There’s lots you can do within Azure Monitor as shown below but for our post we will just focus on the Application Insights part.
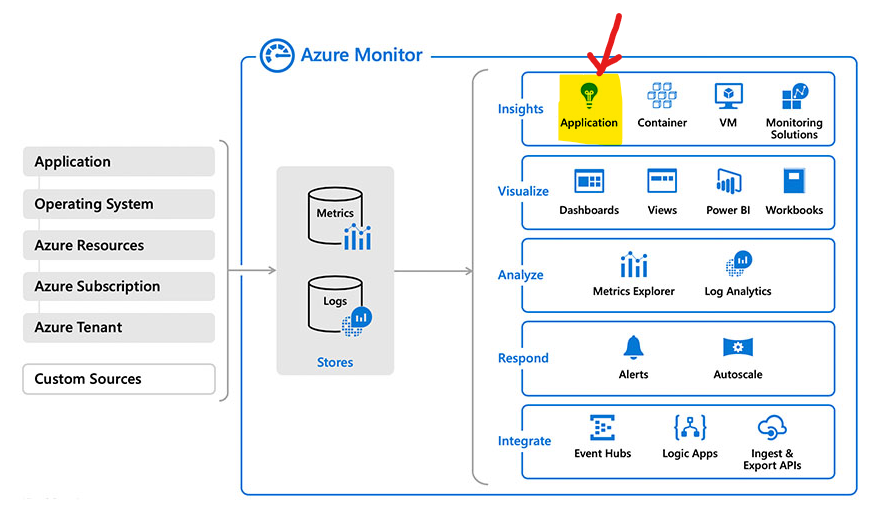
Application Insights itself lets you monitor lots metrics such as Request rates, Response times, Failure rates, Exceptions, Usage tracking, etc (you can refer to the previous Application Insights link for the comprehensive list).
OK, So how do we get started. NOTE: You will need Azure subscription to proceed with the following.
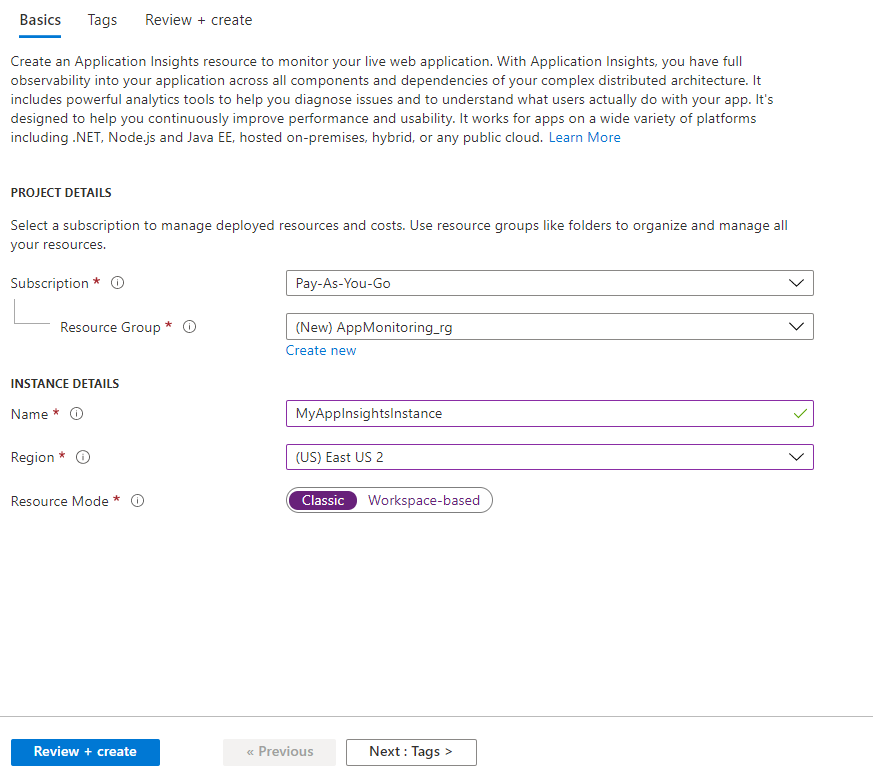
First, Create Application Insights Resource
Log into your Azure subscription, select Application Insights as the resource and create an instance as shown below: (for now we will just create a classic resource mode)
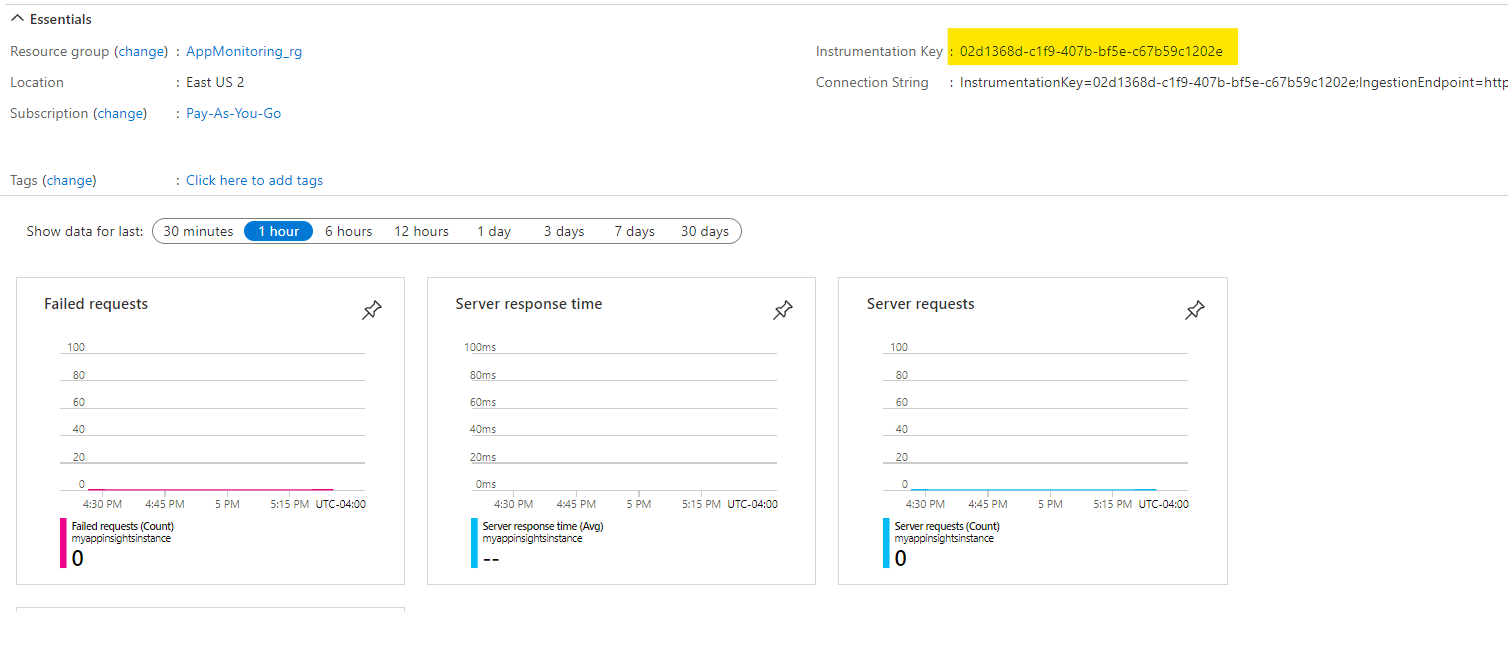
Once provisioned, navigate to the resource and copy the instrumentation key as we will need this in the next step.
Next, Enable Application Insights in your .Net core Web App
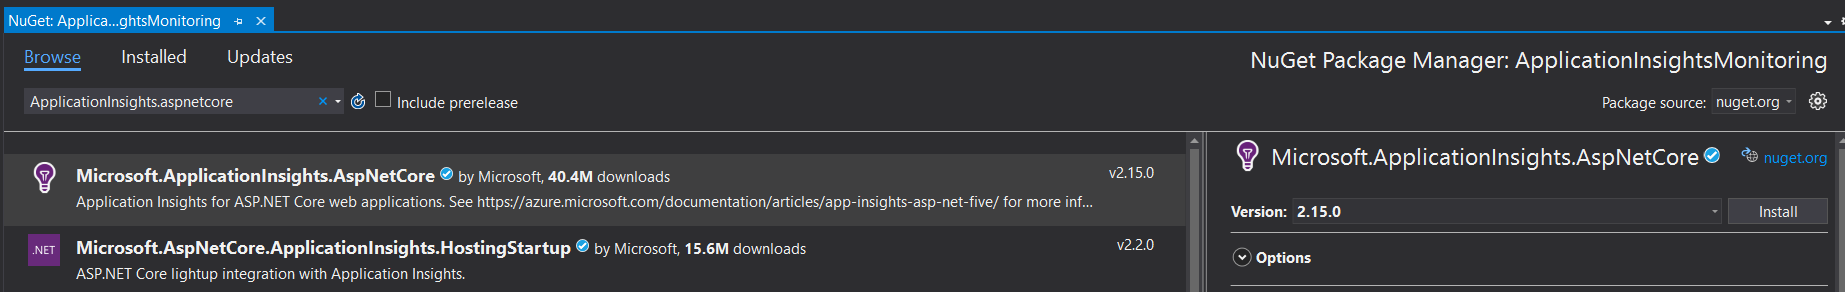
In order to enable Application Insights for you app, you have to download the appropriate NuGet package as shown here:
Then, configure the Startup.cs class ConfigureServices method to include the telemetry component as shown here:
public void ConfigureServices(IServiceCollection services)
{
    // The following line enables Application Insights telemetry collection.
    services.AddApplicationInsightsTelemetry();

    services.AddControllers();
}
Next, include the instrumentation key in the appsettings.json file as shown here:
{
  "ApplicationInsights": {
    "InstrumentationKey": "INSTRUMENTATION-KEY"
  },
  "Logging": {
    "LogLevel": {
      "Default": "Information",
      "Microsoft": "Warning",
      "Microsoft.Hosting.Lifetime": "Information"
    }
  },
  "AllowedHosts": "*"
}
Thats it!!!
With this basic setup, when you launch the default Webforecast controller a few times, data automatically gets collected in Application Insights resource in your azure subscription.
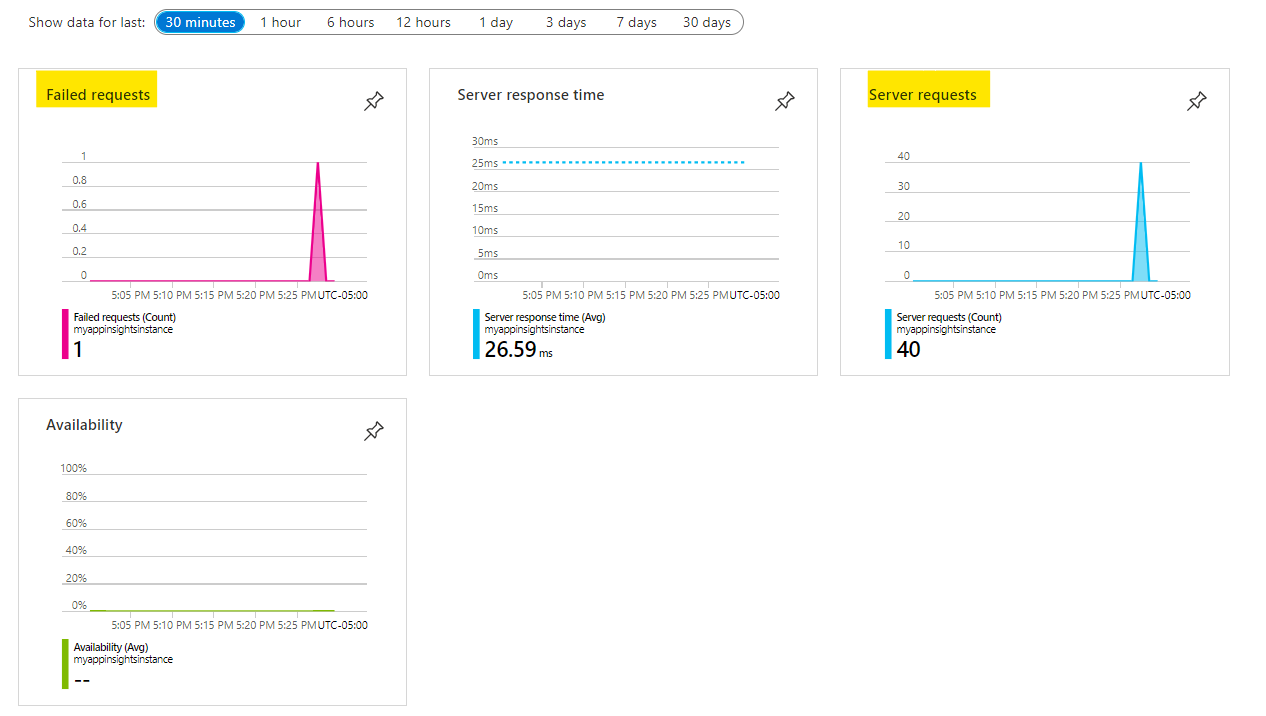
The following are the screen shots of the metrics collected after running my application a few times….by default, you can see Failed Requests, Server Response time, Server requests, Availability.
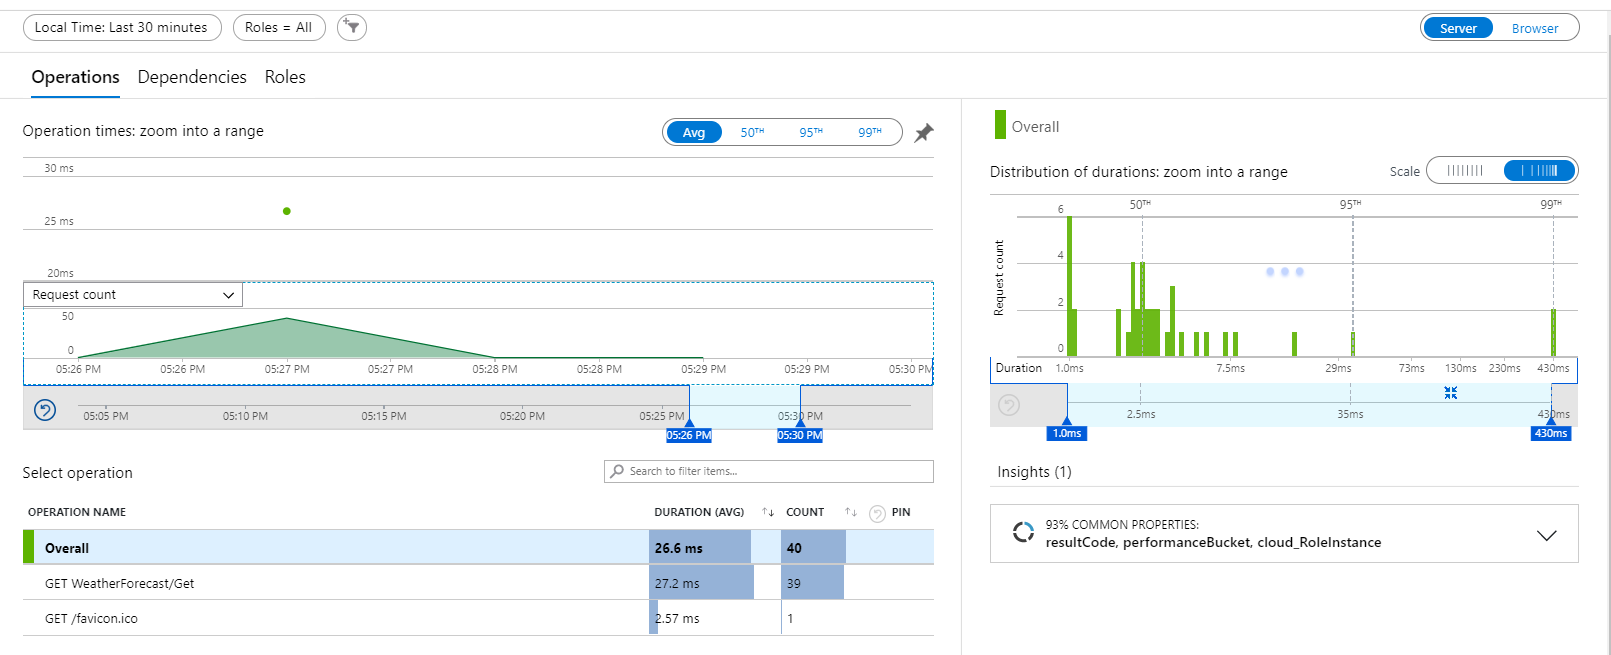
You can drill down further by clicking on the individual chart, the following is when you are looking at the server requests chart details:
Further clicking on the Applcation Map shows the following. Note: I renamed my Application Insights instance to the appropriate meaningful name. You can also achieve that by using configuration, we can look at that in the next post.
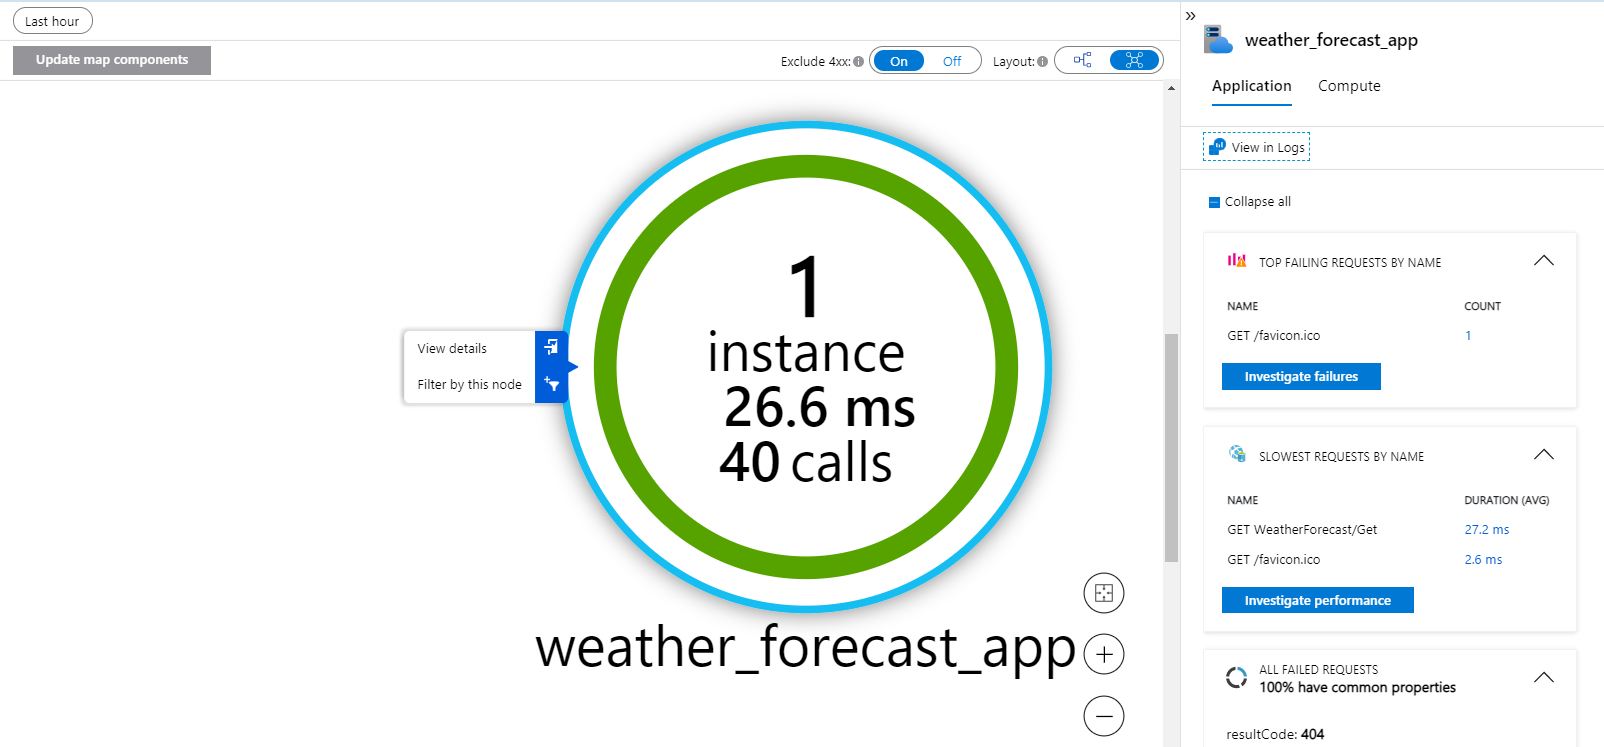
As you can see, this is not bad at all… with just minimal configuration and not much code, you can get decent insights into your application.
In the next post we will build on this further…We will see how we can add custom metric logging into our App and then in the following post look into some Kusto language capabilities to get additional insights from our app logging.
Stay Tuned!!!